Pachama’s latest documentation paves the way for transparent, standardized and high-integrity crediting.
The carbon market is at a promising moment of transition as it seeks to build real confidence in the climate impact of carbon crediting. There is now basic agreement about the path forward: a transition to standardized crediting powered by satellite observations, or as it’s now often called, DMRV (digital measurement, reporting, and verification). While many believe that DMRV will be critical to scaling high-integrity carbon markets, important questions remain about how to best implement these technologies with trust.
Several of the latest crediting methodologies (e.g. Verra’s VM0047 & VM0048) require satellite-derived maps for baselines and other core crediting quantities. But, as we showed in our recent Research Brief, there are many methodology-compliant approaches that can lead to very different outcomes. So, how do we ensure DMRV technologies are accurate? How do we quantify their uncertainty and best adjust credit issuance accordingly? And how can we build solutions that are transparent and easy to understand? For DMRV to deliver on its promise, we must answer these questions.
Today, Pachama is releasing Algorithm Technical Documents (ATDs) that aim to address these questions for two of our core technologies: Canopy Height Maps (CHM) and Dynamic Control Area Baselines (DCAB).
Download our Algorithm Technical Documents
A detailed review of our core methods and data sources and how we validate performance.
Pachama’s Canopy Height Maps (CHM) and Dynamic Control Area Baselines (DCAB) are essential building blocks for our suite of DMRV tools. These tools address quantification challenges – ranging from project site selection to credit issuance and ongoing project monitoring – for both reforestation and avoided deforestation (REDD+) projects.
What is a Canopy Height Map?
A canopy height map is a map where each pixel value represents the forest height within the pixel, which is strongly correlated with its carbon stock. Estimating a project’s climate impact, and ultimately its fair credit issuance, boils down to being able to track carbon stocks in the project and the surrounding landscape over time. This is why Pachama’s Canopy Height Model (CHM), as well as the carbon maps Pachama derives from its CHM, are essential to all of our DRMV tools.
What is a Dynamic Baseline?
A baseline is the “business-as-usual” scenario for a carbon project. In the past, baselines have been calculated by making assumptions about future land use. Baselines also remained fixed over long periods of time, despite the fact that “business-as-usual” land use was often changing. A dynamic baseline revises these assumptions more frequently, but may still be based on predictions. However, Pachama’s Dynamic Control Area Baseline (DCAB) quantifies “business-as-usual” differently: actually monitoring what happens in areas that don’t have a carbon project on an ongoing basis. These ‘control areas’, are just like the control group for a drug trial. DCAB doesn’t make any future predictions; instead, it determines the baseline by simply observing the control area year after year. Pachama’s DCAB algorithm uses satellite data and artificial intelligence to automatically select the control area and compute both the baseline and the baseline’s uncertainty.
Ready to harness DMRV to find a great carbon project?
Get in touch with our team of experts to explore how to use tech today.
Application 1: Identify the ideal land for a carbon project
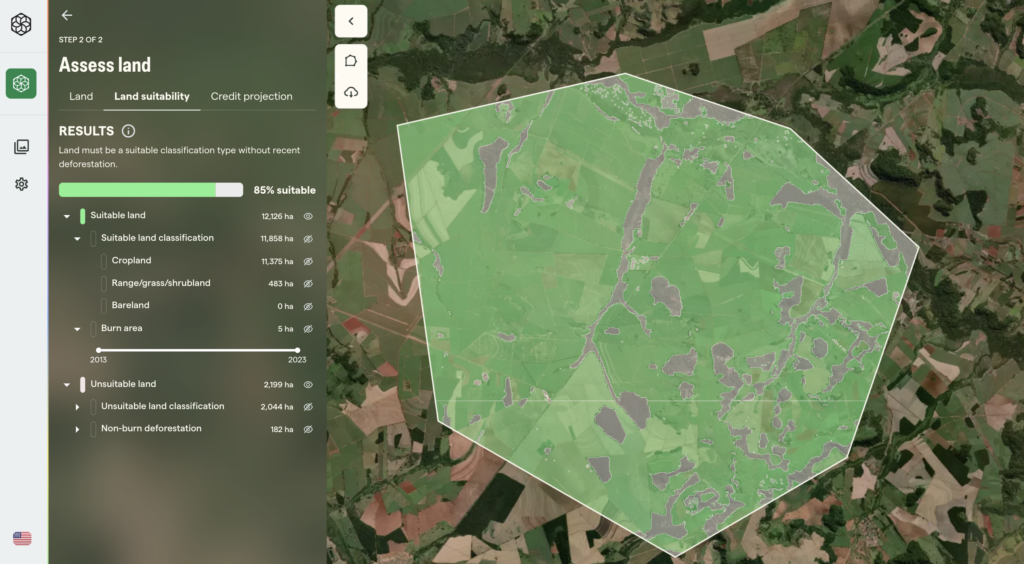
Pachama’s Land Suitability tool helps project developers ensure projects meet key requirements of Verra’s reforestation methodology (VM0047) and optimize for high-quality project design by examining things like historical forest cover, current land use, and natural risks, such as fire and floods. The Land Suitability tool leverages Pachama’s CHM to run crucial project integrity checks. For example, the tool evaluates whether a project currently has low canopy height, because areas with taller existing forest can be more likely to recover on their own without carbon crediting. The tool also evaluates whether a project was deforested in the recent past to ensure carbon crediting for reforestation doesn’t provide an incentive for deforestation.
Figure 1. Pachama’s Land Suitability tool enables users to assess a project’s alignment with key registry requirements and optimize for high-quality project design.
Application 2: Estimate expected crediting for a carbon project
Pachama’s Dynamic Baseline tool allows users to calculate the methodology-compliant (VM0047) baseline for their reforestation project: either an estimate of the likely baseline before the project start or the actual dynamic baseline used for credit issuance. The tool helps facilitate baseline due diligence and forecasts of expected credit issuance, which are essential inputs for any potential investor that have historically lacked rigor. Our Dynamic Baseline tool leverages our CHM to find the control area that best matches the project and to monitor canopy height change within the project and the control area.
Figure 2. Pachama’s Dynamic Baseline tool enables users to compute methodology-compliant (VM0047) reforestation baselines before and after project start.
What’s new? Scaled tech now integrated into our intuitive tools
We’re excited to share our progress on these two essential fronts: CHM and DCAB. Both are sufficiently mature to deploy in our DMRV tools, which automate key calculations for developing and investing in high-quality carbon projects at scale.
Market actors, including project developers, investors, and credit buyers, expect standardized, reproducible crediting to confidently make investments. Compliance with registry methodologies isn’t enough. Why? Registry methodologies are a bit like new recipes that, understandably, haven’t yet been put to the test in the kitchen. They define ingredients (e.g. data inputs) and steps (e.g. calculations), but haven’t yet determined how these new practices (e.g. utilizing complex satellite data and algorithms) will actually work. The ATDs we’re releasing today seek to fill this gap. They go above and beyond registry requirements to investigate important technical details and highlight implications for crediting policy. Here are the key findings:
Canopy Height Mapping (CHM): We show that our canopy height maps agree well with ground-truth data (airborne lidar) and, importantly, agree well over actual reforestation projects, where trees are relatively small over the first few project years. We also show how canopy height uncertainty decreases with larger projects, an important consideration for project design.
Dynamic Baselines (DCAB): We show that our dynamic baselines have low uncertainty and agree across different ways of selecting a control area, including both pixel-level and parcel-level selection.
Pachama Science and R&D
Explore our expertise, research and some of our perspectives on the future of the carbon market.
Pachama’s ATDs are public documents meant to outline the methods, data sources, and performance of the tech behind our DMRV tools. We believe that transparency is paramount, particularly amidst a crisis of trust in the carbon market. Why? DMRV technologies, though nascent, cannot be a black box.
We certainly don’t expect everyone to read an ATD from start to finish, but we hope technical market actors will consider these findings to help evolve market policy.
We aspire to achieve two, intertwined outcomes:
We hope our findings can help shift today’s third-party auditing from checking input calculations to one of validating their accuracy against independent, ground-truth data.
We want to foster industry-wide collaboration to help establish this third-party DMRV validation.
Until that time, we’re committed to transparently sharing progress in our DMRV tools and the supporting algorithms.
What comes next
The ATDs we’re releasing today paint an encouraging picture for high-integrity reforestation crediting. They show that dynamic baselines for reforestation can be computed with the level of confidence the market demands to prove additionality. Pachama’s project monitoring tools, in turn, seek to make sure reforestation projects sequester carbon for the long-term. With this combination of both additional and durable carbon removal, reforestation can emerge as a trusted and verifiable option for carbon mitigation.
Pachama continues to test its DMRV tools across more geographies and more project types to learn and to improve our methods. As we iterate, we’ll continually update our ATDs. And as we develop new algorithms underlying our tools, for example, extending canopy height mapping to carbon mapping, we’ll release additional ATDs.
Build your nature strategy
Chat with our experts to design a portfolio that meets your needs