Authors: Noah Golmant, Martha Morrissey, Carlos Silva, Felix Dorrek, Bernhard Stadlbauer, Rachel Engstrand, and Dick Cameron
Corresponding author: Carlos Silva: carlos@pachama.com
Summary
The market for forest carbon credits has the potential to make a meaningful contribution to climate mitigation. However, recent analyses have called into question the accuracy of baselines used to compute project emissions reductions (1–4). A baseline is the business-as-usual estimate of expected carbon emissions in the absence of a carbon project.
Over the last year, Pachama has been developing a dynamic baseline, which, similar to recent publications (1–3), algorithmically selects a control area as a suitable comparative reference for the carbon project. Our dynamic baseline reports annual deforestation in a control area matched to the project across a range of satellite-observed attributes. A project’s impact on deforestation can be quantified by subtracting annual project and control area deforestation.
Pachama has closely followed the much-needed discussion of baseline integrity in both academic papers and popular media. While we prepare detailed technical documentation of our baseline approach, we did not want to delay releasing some of our initial validation results. Pachama is seeking feedback on our approach from technical experts, market participants, and other stakeholders. We believe that transparent review of methods and validation results is essential to significantly enhancing crediting integrity.
Here we present an initial validation of our dynamic baseline across six REDD+ projects in Brazil. These six projects are presented as case studies, because they are too few to draw robust conclusions about the overall prevalence of REDD+ over/under-crediting. Our preliminary results suggest two projects were consistently over-credited and one was consistently under-credited. Over/under-crediting can vary by year, as we particularly observed for one project. Existing baselines for the two remaining projects largely tracked the dynamic baseline.
We find that our baseline approach generally has low enough uncertainty to evaluate whether existing project baselines are significantly over-credited. Assessing less pronounced over/under-crediting requires reduced baseline uncertainty, which we believe is achievable by addressing known limitations of the analysis presented here.
We emphasize these are initial findings, and that as we continue this research, our results and interpretation may change. Our hope in releasing these initial results is to receive critical feedback to improve our methods, advance public discussion, and ultimately operationalize rigorous baseline methods for credit issuance.
Approach & Methods
Control area selection: pixel-level matching
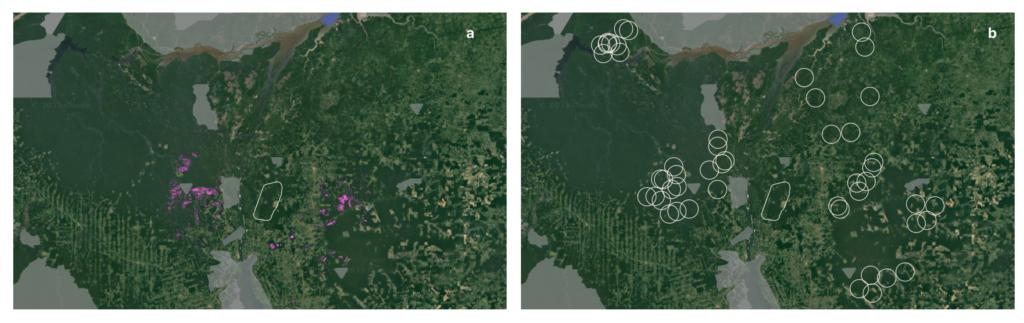
Pachama uses a k-nearest neighbor (k-NN) algorithm to match the carbon project to a control area within a search region (5, 6) (Fig. 1a). Here we use a 100 km buffer surrounding the project as a search region, but we have the computational infrastructure to select control areas over substantially larger regions. Each pixel is represented by a feature vector consisting of an array of attributes derived from satellite observations. We match each individual pixel within the project to its nearest neighbor (i.e. the search region pixel with the minimum difference across the array of features). Matching features are currently weighted equally.
We perform default k-NN matching at 100m resolution, but are investigating baseline sensitivity to matching spatial resolution. The control area baselines presented here use our minimal default set of matching features: slope, elevation, tree cover, gross primary productivity (GPP), and distance to several land cover/use types: deforestation within the last 5 years, water, pasture, and agriculture. Our dynamic baseline Algorithm Methods Document (AMD) details the data sources for each of these matching features1. Pachama is continuously testing additional matching features to improve baseline performance. We observe annual deforestation within the control area, using the Global Forest Watch – University of Maryland (GFW-UMD) forest loss product (7).
Baseline uncertainty: pseudo projects
The control area approach employed here and in recent publications (1, 3, 4) enables baseline validation against independent observations using pseudo projects. Pseudo projects are randomly selected forested areas without a carbon project. We use k-NN pixel matching to select control areas for 50 circular pseudos (Fig. 1b)2, each equal in area to the carbon project. As each pseudo and its control area both have no carbon project, their annual deforestation rates should match. We quantify annual baseline error by comparing observed deforestation in pseudos and their control areas.
We randomly sample pseudos within a 300 km buffer surrounding the project. Our current sampling selects pseudos within one standard deviation of the mean for the following project features: percent tree cover and distance to deforestation within the last five years. We exclude existing conservation areas (IUCN database3) and Verra carbon projects4 from our pseudo project search area. We can also specify the degree of allowable pseudo project overlap.
Initial results
Project-level crediting and uncertainty
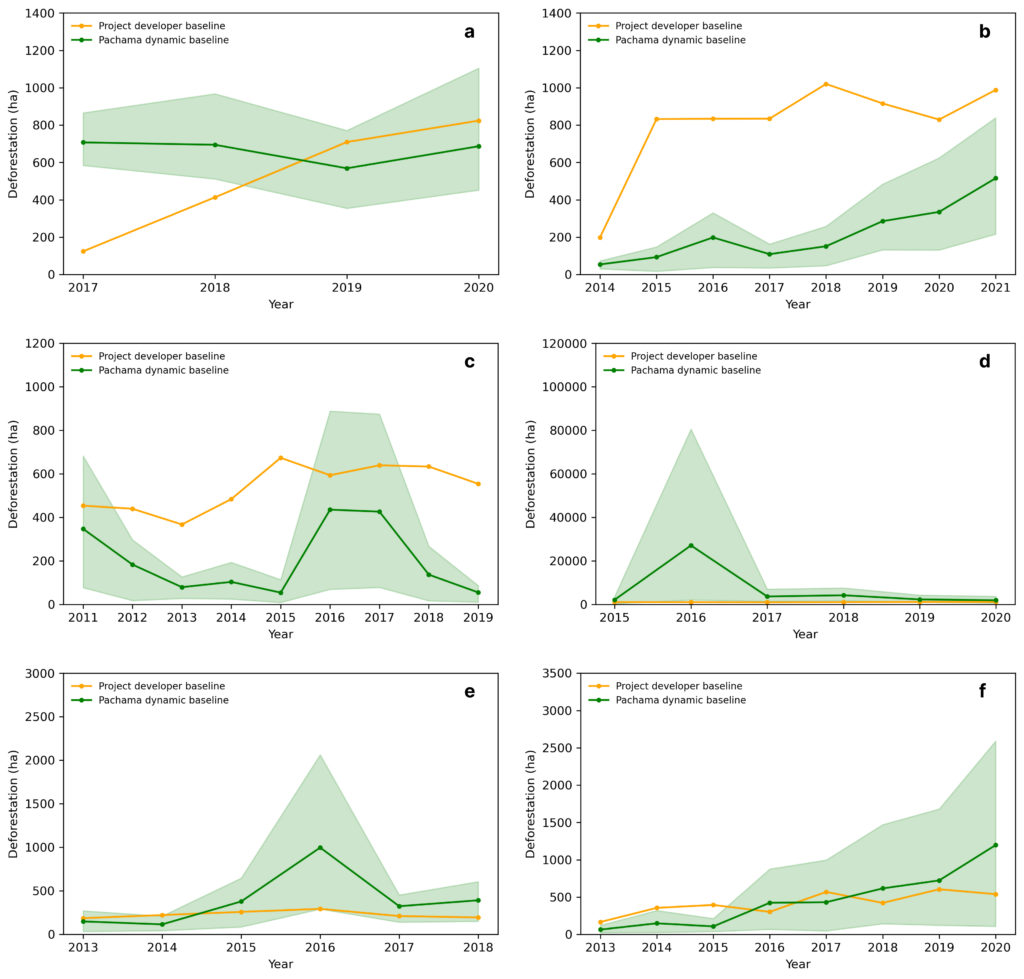
Our preliminary results suggest two projects are substantially over-credited (Fig. 2b, 2c), and one is under-credited (Fig. 2d) over nearly all years since the project start date. The baseline for two projects largely tracked our dynamic baseline (Fig. 2e, 2f). Over/under-crediting varied substantially by year for the remaining project (Fig. 2a).
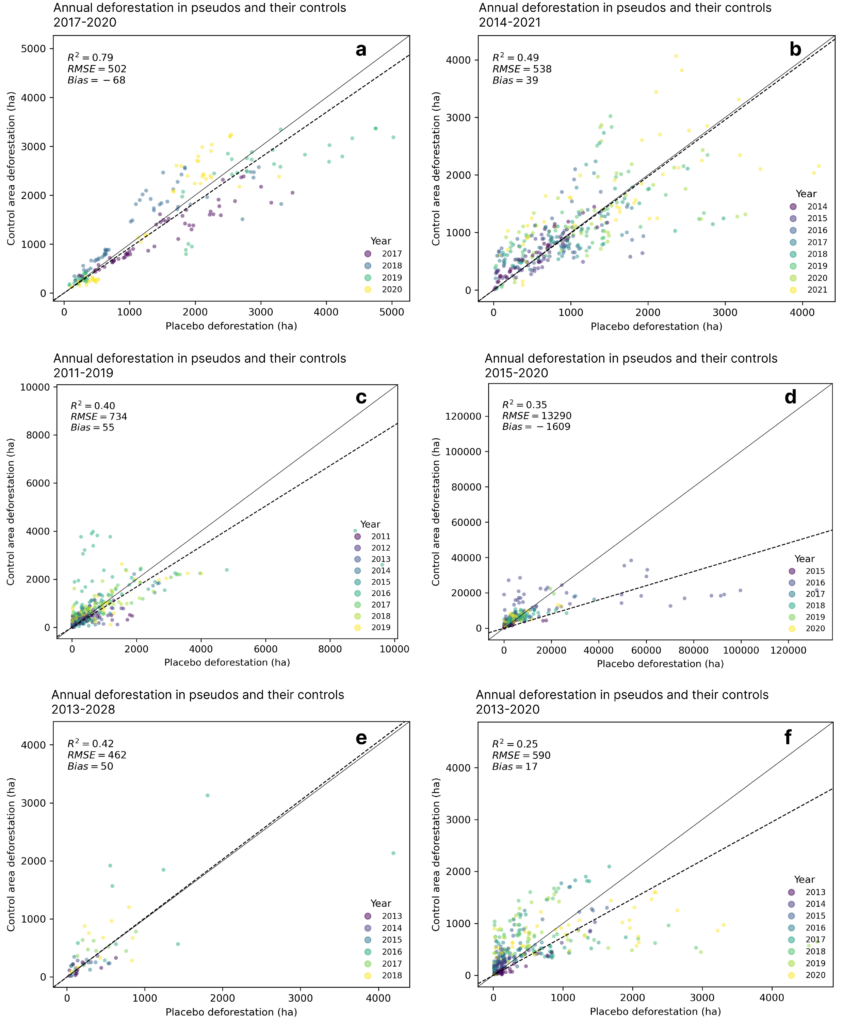
Our baselines were generally unbiased across the six projects with a relative root mean squared error of 49% (Fig. 3).
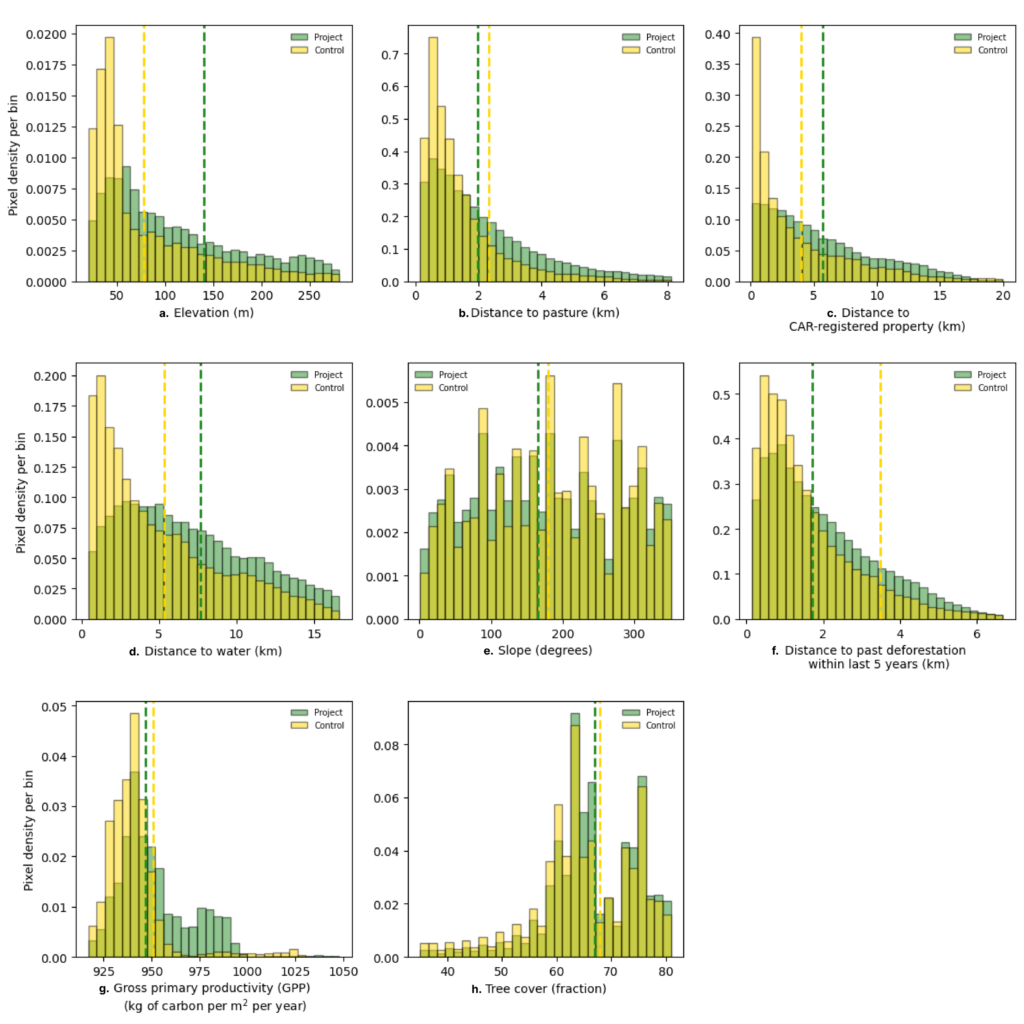
Fig. 4 shows feature similarity between a sample project and its control. Large pseudo outliers (pseudo – control error) (Fig. 2d), which suggest room for improving our pixel-matching, generally seem to occur when input feature matching is poor.
Next Steps
Pachama is expanding the geographic coverage of our input datasets to be able to run dynamic baselines across more regions for both REDD+ and non-REDD+ projects. We are also actively pursuing several lines of work to further improve and validate our baseline approach.
Reduce uncertainty
We expect key improvements to our current approach may reduce baseline uncertainty. We are testing annual, rather than static, matching features for quantities likely to vary over time (e.g., annual distance to recent deforestation and land use class).5 We will also test feature weighting and weighting across >1 nearest neighbor.6
Pseudo project sampling
A key objective of our pseudo sampling is to compare baseline performance across methods and parameter combinations.7 We are currently exploring jurisdictional pseudos for model selection – a set of fixed pseudos spanning a range of project sizes and observed deforestation rates within a political jurisdiction. We will use this fixed set of pseudos to determine the best input features and model parameters within a jurisdiction.
Baseline intercomparison
Overall confidence in baseline estimates would substantially increase if baselines approximately converged across methods or discrepancies were well-understood. To this end, Pachama is actively testing other baseline approaches.
Nested baselines: jurisdictional risk mapping
Verra has recently proposed a consolidated REDD+ methodology that would define project baselines as a nested portion of the historical deforestation (baseline) within a political jurisdiction. This approach allocates a portion of the jurisdiction-level baseline to a project using a deforestation risk map. Nesting would standardize baseline calculations across projects and simplify carbon accounting between the project and jurisdiction-level carbon markets. West et al. (2023) also note in their recent preprint the advantages of nested baselines (2).
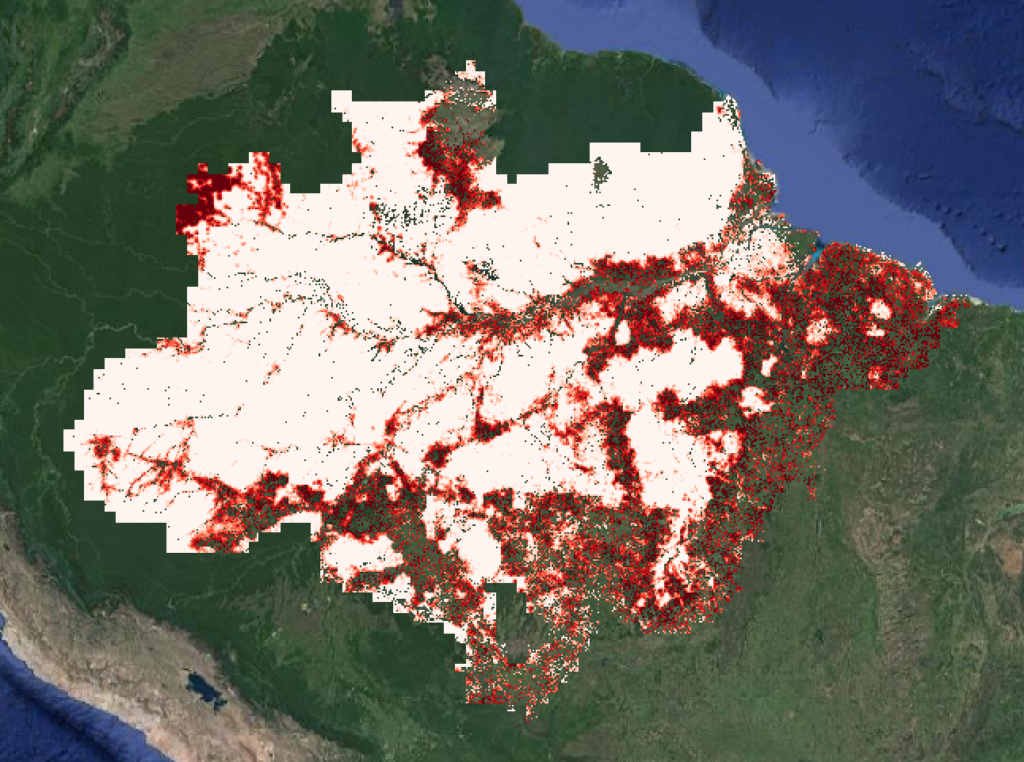
Pachama has produced initial deforestation risk maps for the Brazilian Amazon using forestatrisk, an open source modeling package (8) (Fig. 5), and we have already computed project-specific baselines using Verra’s proposed nesting approach. Preliminary results for a few projects suggest rough baseline agreement between the control area and risk-mapping approaches. However, we are pursuing a rigorous intercomparison using the same pseudo set and same input features for both control area selection and risk mapping.
Market & Policy Implications
We believe our results taken together with recent publications (1–3) demonstrate that it is possible to compute robust algorithmic baselines with well-characterized uncertainty. These approaches delineate a clear path forward for improving credit integrity and public confidence in this critical market mechanism for financing carbon sequestration and forest conservation.
The crucial step is transitioning these algorithms from research to operational market use. Pachama is actively working on a pilot Digital Monitoring, Reporting, and Verification (DMRV) system that would enable automated and standardized validation of project baselines.
There remain open policy questions about how best to operationalize algorithmic baselines for credit issuance. We encourage more communication and collaboration between researchers, registries, and market stakeholders, so that ongoing baseline studies can directly inform the design of future crediting rules. For example, we propose a common, publicly available set of pseudos shared across researchers and credit registries for validating both dynamic and nested (i.e. risk mapping) baselines.
FOOTNOTES
We presently use the MAPBIOMAS product, which encompasses the Brazilian Amazon, to compute distance to land use classes for pixel matching. To run dynamic baselines in other regions, we are testing alternate global datasets, such as Dynamic World.
We bootstrapped baseline error metrics (placebo – control area) using up to 100 placebos. We found 30 placebos are sufficient for convergence to stable error metrics.
International Union for the Conservation of Nature
Pachama expects to exclude all existing carbon projects from control areas and placebos. A centralized, publicly accessible database of project boundary files would greatly facilitate this, as we simply scraped publicly available Verra boundary files.
For example, we’ve found that a static distance to nearest roads derived from Open Street Map (OSM) worsened baseline performance. We are seeking to integrate a more frequently updated roads dataset as a matching feature.
Verra’s proposed dynamic baseline methodology for Afforestation, Reforestation, and Revegetation suggests this.
Pachama’s benchmark model is a “null” baseline. Instead of k-NN pixel matching to select a control area, our “null” control area is a simple 50km buffer around the project, which allows us to quantify k-NN explanatory power relative to a simple regional background deforestation rate.
REFERENCES
T. A. P. West, et al., Action needed to make carbon offsets from tropical forest conservation work for climate change mitigation (2023) https:/doi.org/10.48550/ARXIV.2301.03354.
G. Demarchi, J. Subervie, T. Catry, I. Tritsch, Using Publicly Available Remote Sensing Products to Evaluate REDD Projects in Brazil. SSRN Electronic Journal (2021) https:/doi.org/10.2139/ssrn.4090218.