
Forest conservation and restoration could contribute as much as 30% of what’s needed to achieve this decade’s Paris Agreement goals1, but without a trusted and efficient means to measure their carbon impact, funding for these projects has been limited. Satellite-based monitoring and machine learning offer a new solution that can unlock investment at the speed and scale the planet demands.
Forests are a high-impact and cost-effective part of the solution to climate change. Although meeting the Paris Agreement is not possible without cutting fossil fuel emissions, forests can contribute up to 30% of what’s needed to meet near-term goals, while simultaneously providing tremendous benefits for local communities and biodiversity.
Fully realizing this potential is no small task. It requires driving net deforestation to zero and reforesting an area about 10 times the size of Texas. In short, this would require scaling the existing forest carbon market by at least 100x to channel billions of dollars in funding for forest conservation and restoration projects over the next decade.2
Today, the funding fueling carbon markets comes from the purchase of carbon credits. Each carbon credit represents a one metric ton reduction in carbon emissions, which is used by the buyer to compensate for one ton of carbon emissions produced elsewhere. But estimating the amount of carbon reduced by forest conservation or restoration projects is costly and highly manual, requiring project owners to measure individual trees by hand. Despite surging demand for new forest carbon credits, these manual processes have led to countless delays in getting new projects off the ground.
But new satellite-based technologies offer a far more scalable, cost-effective solution that can dramatically accelerate investment in nature. In this article, we’ll provide insight into how forest carbon is calculated today, how Pachama is using satellite-based technologies and machine learning to build global carbon maps, and what our science reveals about the accuracy of these new tools.
How is forest carbon calculated today?
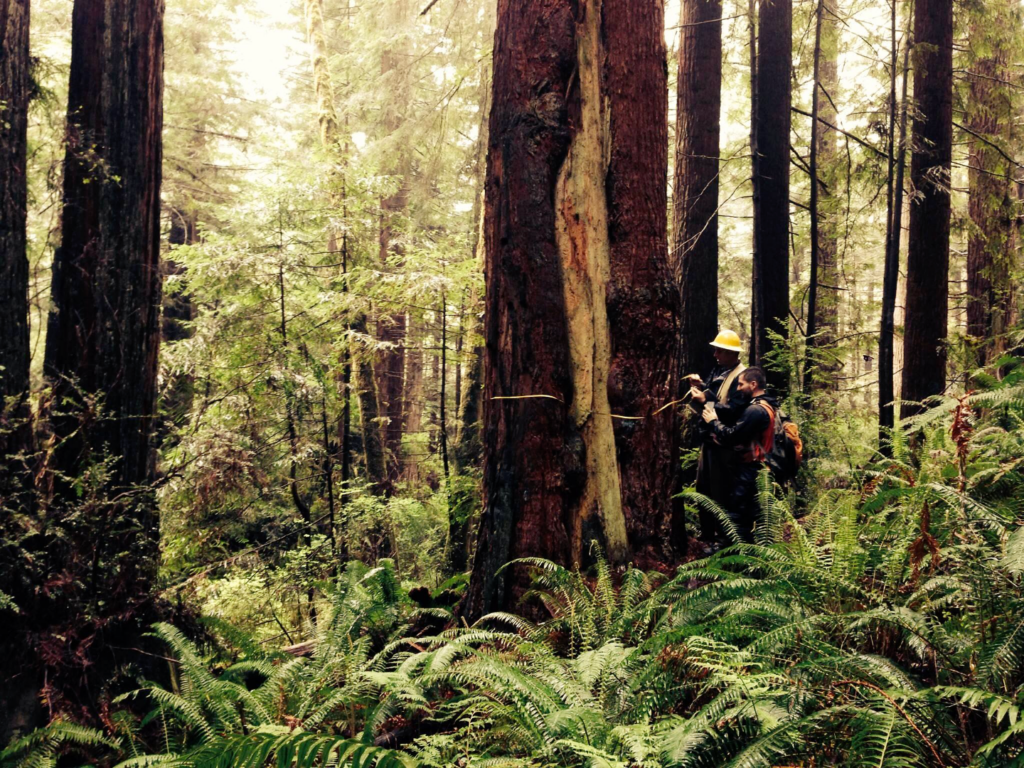
Let’s start with the basics. Today, project developers send crews to the field to conduct carbon inventories by hand. These crews measure the height and diameter of trees in plots randomly sited throughout the project (Figure 1).3 Each tree’s carbon is then estimated based on its height and diameter.
These inventories are labor-intensive and ultimately cannot scale at the speed the planet demands. Projects are often located in remote areas of the world, or even areas with armed conflict. It can take weeks or months to measure trees across just 30 plots for a single project and cost tens to hundreds of thousands of dollars. And they must be repeated every five to ten years over the project’s lifetime.
Satellites and machine learning can map forest carbon at scale
Are satellites the silver bullet? Not quite. Satellites cannot directly measure the amount of carbon in a forest. However, they can observe forest attributes, such as tree height and 3D structure, that are closely related to carbon. And with the right machine learning models, we can interpret these observations to get sound carbon estimates.4
Does this mean we don’t need to measure trees by hand? Again, not quite. To train our machine learning models, Pachama relies on manual inventories, but we’ll need far fewer. Instead of requiring an inventory for every project, we can build models that are validated for a particular region and apply those models to the data acquired by satellites.
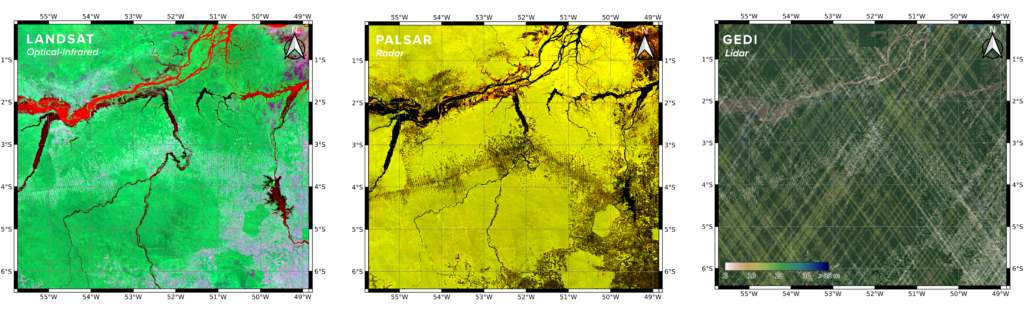
What data do we gather from satellites? Pachama uses three types of satellite observation to map forest carbon: optical-infrared, radar, and lidar (Figure 2).
Optical-infrared observations can reveal how much green leafy material and chlorophyll are in a forest.5 Think of these observations as a measure of “greenness.”6 But a satellite pixel can only look so “green,” even as trees become taller and thicker.7 So, optical-infrared observations alone can’t tell us everything we need to calculate carbon. Instead, we need to go beyond how “green” a canopy is to get a fuller picture of the three-dimensional structure of the forest.8
Spaceborne radar and lidar are critical data sources that Pachama uses to observe a forest’s structure. These technologies send pulses of energy that bounce off the Earth’s surface. When the pulses pass through a forest, the returning energy carries a signature of the trees’ three-dimensional structure, giving us a far better sense of their true carbon content.
Lidar observations are the most intuitive to understand. NASA’s GEDI lidar produces a vertical profile of the forest, revealing both the height of the forest as well as the vertical distribution of branches and leaves from the ground to the top of the canopy.
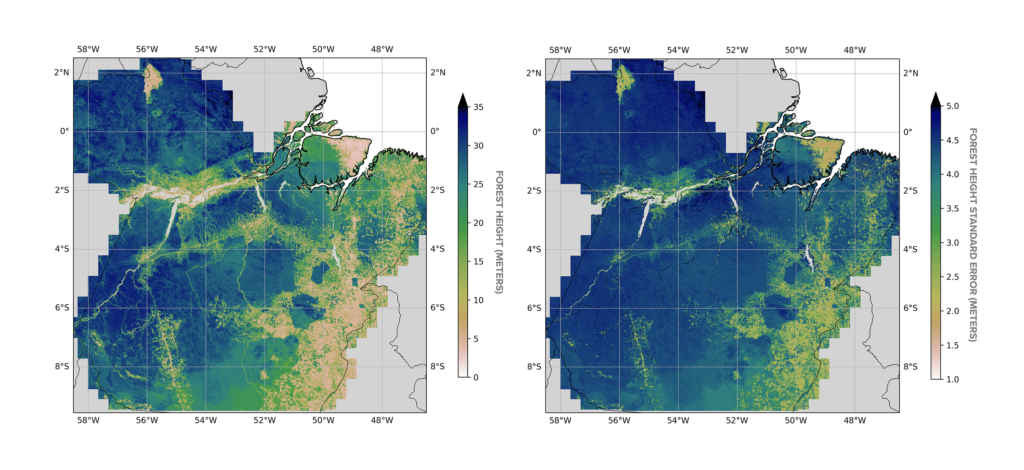
Pachama currently uses satellite observations to map forest height as well as the height of different canopy layers in the forest. We are now using these height maps to increase the accuracy of our carbon mapping.9
How accurate are satellite-based forest carbon maps?
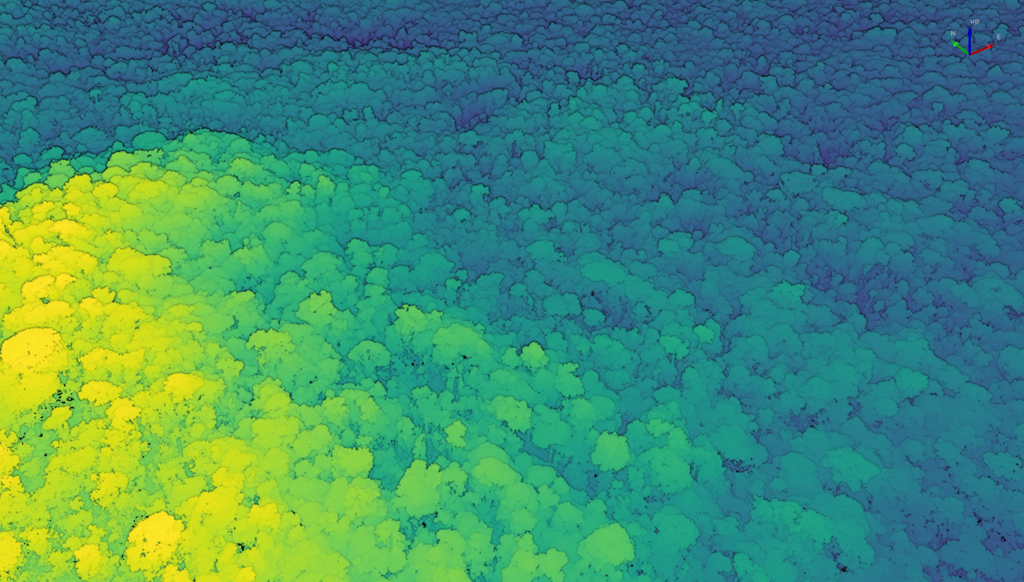
At Pachama, we understand that making carbon crediting more efficient and cost-effective will only solve the challenge at hand, if these measurements can be validated for accuracy. The good news? You don’t have to know how satellites or machine learning work to easily understand the accuracy of our forest height and carbon maps. We always compare our maps to “ground truth,” such as manual plot inventories and airborne lidar (Figure 4), and are committed to publicly reporting our map accuracy. 10 11
This simplicity is crucial. Buyers and the public should be able to quickly grasp what a carbon credit actually is without having to wade through hundreds of pages of PDFs and Excel spreadsheets. As the market matures, Pachama hopes to publicly validate the accuracy of our carbon maps with “ground truth” held by a widely accepted third-party source. We see this as a critical milestone in operationalizing satellite-based mapping for the carbon market and bringing another much-needed benefit to the market: more uniform, fungible crediting.
Where’s Pachama going next?
Pachama has three near-term priorities for getting to scalable, satellite-based credit issuance.
First, we want to show the accuracy of our mapping. Over the remainder of this year, we are focused on validating our forest height and carbon maps. We’ll be sharing these results in a future blog post. We’re also working on an Algorithm Methods Documents (AMD) – a detailed technical description of our data and methods. A future Algorithm Validation Document (AVD) will comprehensively present our mapping accuracy.
Second, we are engaging with leading credit registries to better integrate satellite-based mapping into credit issuance. This involves rethinking current issuance methodologies and procedures for auditing credit issuance.
Third, we want to pilot our satellite-based carbon mapping to issue credits for an actual carbon project.12 So we’ll be working to extend the geographic coverage of our maps. To do so, we need plot inventories and airborne lidar to train and validate our algorithms in new regions. Pachama has recently acquired airborne lidar over the Atlantic Forest in eastern Brazil and the southeastern U.S., and we are planning additional campaigns for the coming year.
We welcome your questions or feedback at science@pachama.com. For media inquiries please contact us at media@pachama.com.
Ready to learn more?
Get in touch with our team to learn how we can help you invest in tech-verified projects or start your own project from the ground up.
Footnotes
Because major cuts to fossil fuel emissions are ultimately necessary to meet the Paris Agreement, the contribution of forests to total emissions reductions required by the end of the century will decline over time.
Annual issuance of forest carbon credits is <1% of annual fossil fuel emissions. Ecosystem Marketplace’s <a href=”https://www.ecosystemmarketplace.com/publications/state-of-the-voluntary-carbon-markets-2021/”>State of the Voluntary Carbon Markets</a> reported credit issuance for forest carbon projects of 111.5 million metric tons CO2 in 2021 (through August). Credit issuance in 2019 and 2020 was 36.7 and 48.1 million metric tons CO2, respectively. Issuance representing actual emissions reductions is much lower. Less than ¼ of the >150 projects Pachama has evaluated to date meet the Pachama Quality Standard. In 2021, global fossil fuel emissions totaled 36 billion metric tons CO2 (Friedlingstein et al. 2022; Liu et al. 2022).
Plots are randomly selected areas within a forest in which the height and diameter of all trees above a minimum size threshold are measured.
Algorithms for solving this challenge have been well-researched by both universities and space agencies, such as NASA and the European Space Agency (ESA) (3–7). However, these advances have yet to be adapted for the carbon market and integrated into routine credit issuance.
Pachama currently uses four sources of optical satellite imagery for forest height and carbon mapping: NASA’s <a href=”https://www.nasa.gov/mission_pages/landsat/main/index.html”>LandSAT</a> and <a href=”https://modis.gsfc.nasa.gov/”>MODIS</a> satellites and the European Space Agency’s (ESA) <a href=”https://www.esa.int/Applications/Observing_the_Earth/Copernicus/Sentinel-2″>Sentinel-2</a> and <a href=”https://earth.esa.int/eogateway/missions/proba-1″>PROBA-V</a> satellites. Pachama uses the Japanese Space Agency’s (JAXA) ALOS-PALSAR radar and NASA’s <a href=”https://gedi.umd.edu/”>GEDI</a> (Global Ecosystem Dynamics Investigation) lidar.
Although the “greenness” of an individual pixel can plateau as a forest becomes taller and denser, Pachama is testing more sophisticated machine learning methods that also exploit texture and shapes within satellite images, such as the size of a tree’s crown.
Prior studies demonstrate that carbon maps using only satellite imagery are no better than simply using the average carbon of the plots used to train the mapping algorithm (8). In other words, imagery-only carbon mapping is not an improvement over manual plot inventories.
A tree’s 3D structure determines its volume and weight. Half of a tree’s weight is carbon due to the chemical composition of wood.
Pachama’s canopy layer maps are formally called relative height (RH) maps. They map quantiles of the forest’s vertical distribution of vegetation. For example, the height below which 50% of the vegetation lies is called RH50.
Pachama computes uncertainty for each pixel in our forest height and carbon maps and total uncertainty across all pixels within a carbon project or political jurisdiction, such as Pará, Brazil. Although pixel-level uncertainty can be large, project or jurisdiction-level uncertainty can be small.
Importantly, we do not use these “ground truth” data to produce our maps, only to quantify their accuracy.
Very few carbon projects have issued credits using satellite-based carbon maps. Scalable, satellite-based crediting will require some changes to existing registry procedures.