Today’s static approach to baselines fails to capture the constantly evolving nature of land use and our forests. We believe a tech-driven, dynamic approach can transform carbon crediting in four key ways.
Last year, our planet lost 25.3 million hectares of forest, an area greater than the size of the United Kingdom.1 The emissions associated to forest loss are sizable, equivalent to as much as one-tenth to one-quarter of fossil fuel emissions each year.2 3 The carbon market offers a way to pay landowners to protect their forests and reduce these carbon emissions.
But, paying landowners who are already protecting their forests clearly does not reduce emissions. For the carbon market to produce net climate benefits, credits must only be awarded to landowners who wouldn’t have protected their forest otherwise. But how do we know what a landowner would have done if they hadn’t received funds from a carbon project? This ‘what if’ scenario is where baselines become very important to carbon markets.
What is a “baseline” and why does it matter?
A baseline represents business-as-usual without a carbon project. The number of credits issued to a landowner annually is the difference between project and baseline carbon emissions – in other words, the difference in emissions with and without a carbon project.
So, it’s not surprising that the baseline often has the largest influence on how many carbon credits a project receives. And, as a result, baselines have rightly come under increasing scrutiny. If a baseline is inaccurate, a project can be issued too many (or too few) credits, calling into question the legitimacy of forest carbon offsets.
How are baselines calculated today?
Methods for calculating baselines vary widely across carbon registries, but almost all try to predict future deforestation based on the past. More robust methods use an actual area nearby the project to predict future deforestation, but still allow a lot of ad hoc, project-by-project discretion when selecting that reference area.4
In the end, all current methods rest on the strong assumption that the future will be the same as the past. And, of course, the future is unpredictable. Things change. Things we can’t possibly predict, such as swings in crop prices, election outcomes, or a pandemic. All of these things can alter business-as-usual deforestation.
Pachama’s analysis suggests that recent deforestation can differ from past deforestation by more than 40%.5 However, baselines today are rarely, if ever, updated over the project’s crediting period. When a project receives too many credits due to a static, out-of-date baseline, the climate ultimately suffers, because those excess credits do not represent real emissions reductions.
Some credit registries are now moving toward more frequent baseline updates, or even adopting dynamic baselines. Pachama is actively developing and testing dynamic baselines for credit issuance.
How does Pachama calculate dynamic baselines?
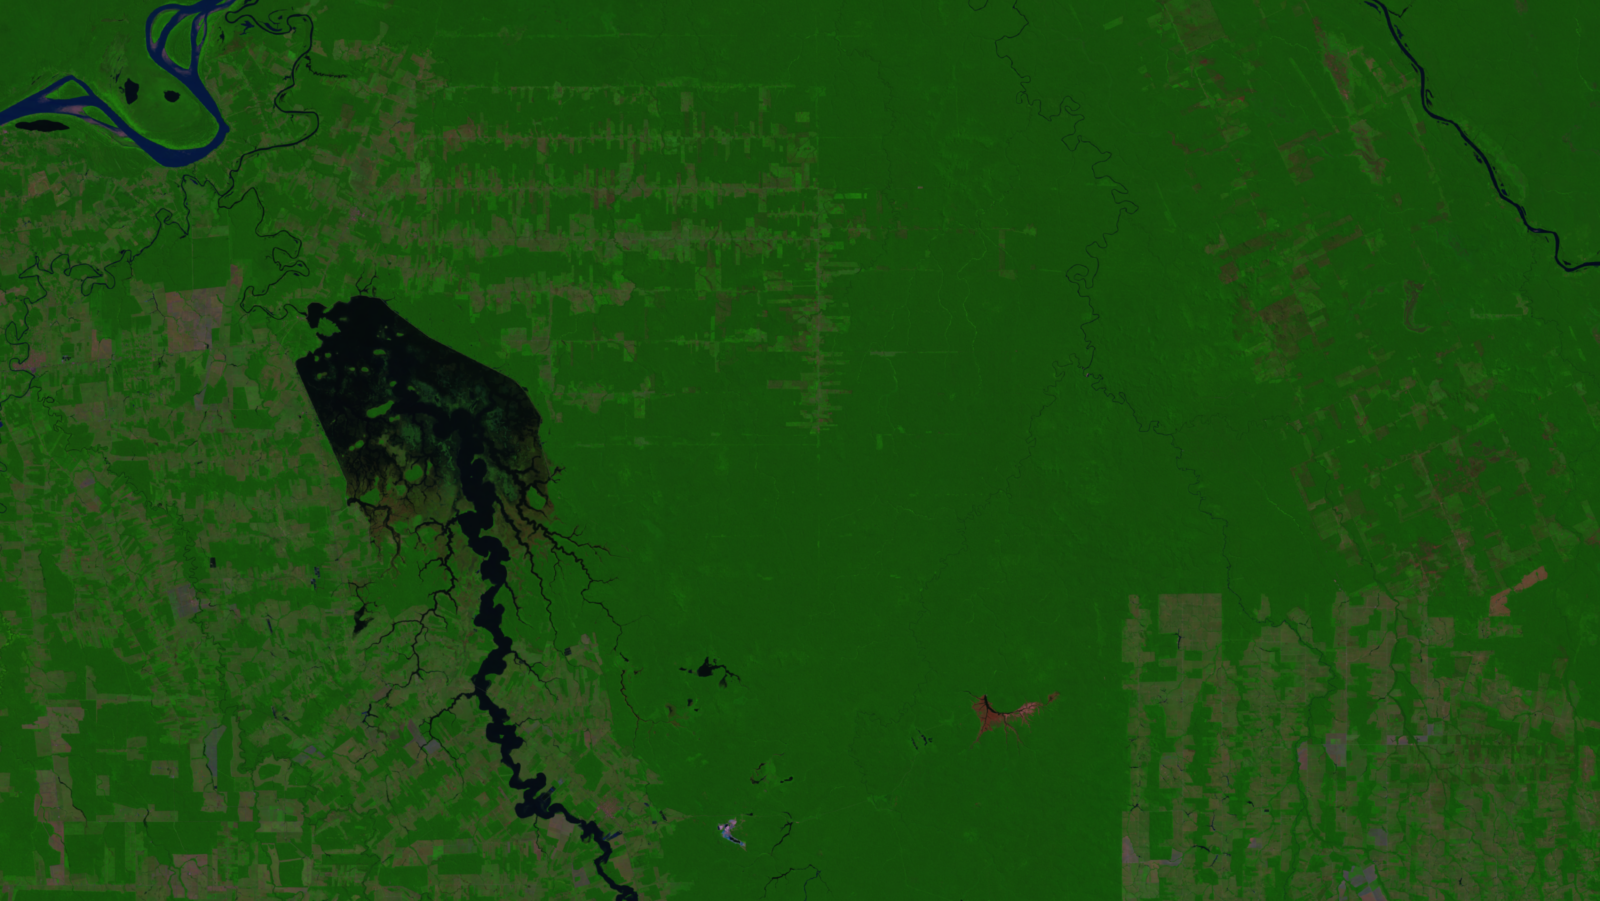
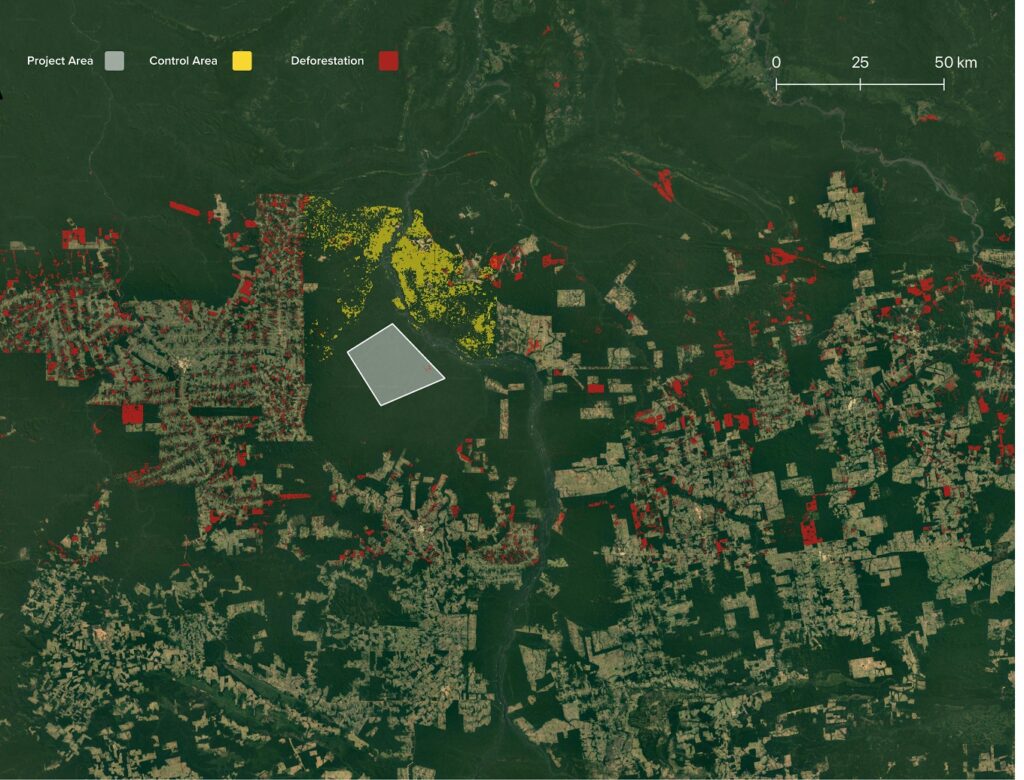
A dynamic baseline does not attempt to predict future deforestation. Pachama uses satellites to observe the constantly changing reality on the ground. In fact, we match each satellite pixel in a project to a pixel outside the project across a range of attributes, such as distance to the nearest road, topography, and forest vegetation density (Fig. 1).
These matching pixels are no different than a control group in any scientific experiment or drug trial. For this reason, we actually call them control areas.
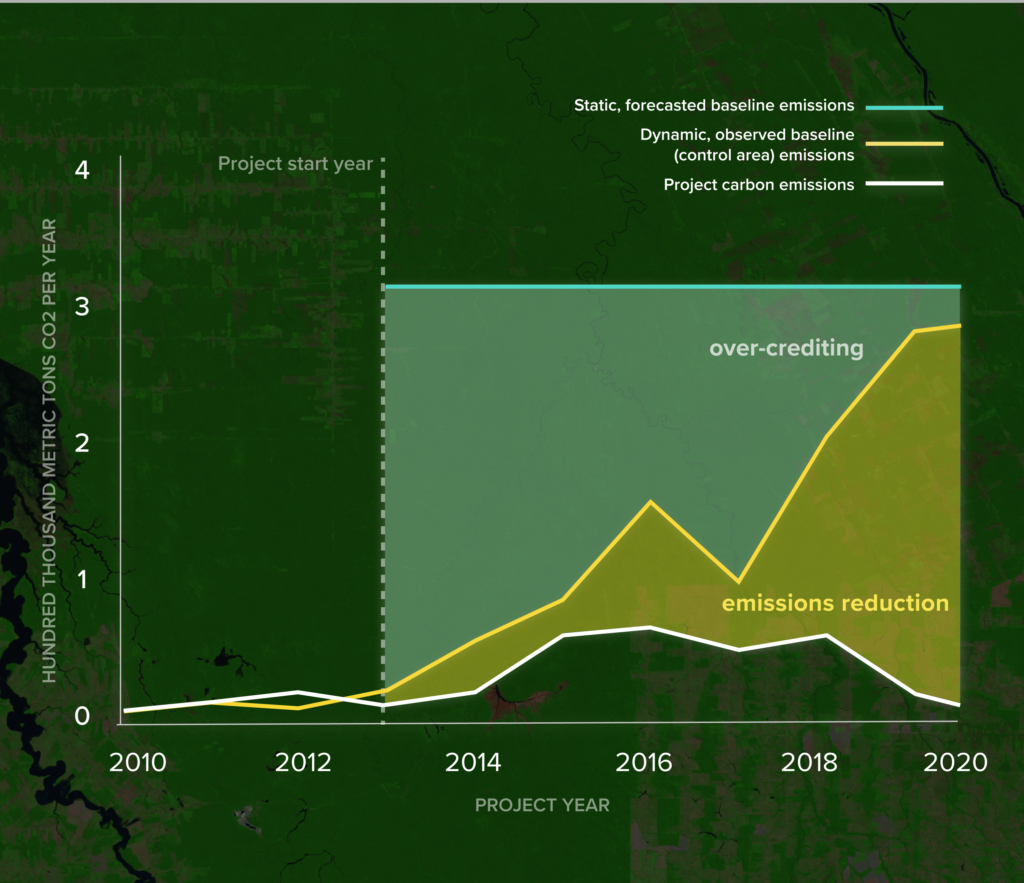
We don’t have to predict what would have happened without a carbon project. We observe emissions in the control area – the matching pixels without a carbon project (Fig. 2).
How enterprises can invest in tech-verified carbon credits
Four ways dynamic baselines can transform carbon crediting
- A dynamic baseline is observed, not predicted. To compute the dynamic baseline each year, Pachama just observes carbon emissions in the control area. The control area is matched to the project to ensure that both experience similar background land use. So if political events, economic swings, or other unexpected shocks alter background deforestation, baseline emissions should adjust automatically.
- The uncertainty of a dynamic baseline can be quantified against actual observations. Current baselines do not report uncertainty. In other words, they are assumed to be perfectly accurate year after year. Pachama actually quantifies baseline uncertainty by constructing control areas for psuedo projects – randomly selected areas without a carbon project. Because the psuedo and its matching control area both have no carbon project, their annual carbon emissions should match. We can compute baseline uncertainty based on how well they match. The number of credits issued can then be adjusted to account for uncertainty.
- Control areas compare like with like. Some registries have allowed unrealistically aggressive baselines for projects on public lands, for example. In contrast, our approach would not make assumptions about activity on public lands, but select and observe control areas on other public lands without carbon projects.
- Baseline calculations are simplified and unified across project types. Today, Pachama is focused on baseline development and validation for avoided deforestation projects, but with additional development, this approach can work for reforestation and improved forest management (IFM) projects as well.
Next steps
Pachama intends to use a dynamic baseline to evaluate existing carbon projects and originate new projects. And we take validation and transparency very seriously. Below are several areas of focus for the Pachama team:
- Baseline Validation: We want to demonstrate that a dynamic baseline quantifies project emissions reductions more accurately than status quo baseline methods.
- Baseline Uncertainty: We are also working to quantify the uncertainty bounds around our dynamic baseline using psuedo projects (described above). We are seeking to reduce baseline uncertainty by investigating factors, such as the size of the search region and choice of satellite observations for selecting control areas.
- Impact on Landowners: As Pachama and the broader carbon market move toward dynamic baselines, we’ve heard concern from landowners about losing the predictable credit issuance that a static baseline affords. Even though dynamic credit issuance may vary more from year-to-year, longer-term average issuance may remain fairly steady. We anticipate that increasing prices for higher quality credits can compensate in part for increased issuance risk. However, there are also ways to reduce issuance uncertainty for landowners without compromising credit integrity. For example, project developers or a platform, like Pachama, could assume the baseline volatility risk and provide fixed payments to landowners. The Family Forest Carbon Program of the American Forest Foundation has piloted exactly this type of risk-sharing partnership.
In our next technical article, we will share initial results from our dynamic baseline validation work, including example dynamic baselines for real projects. To uphold our mission to increase market transparency, we will share the complete validation in a forthcoming Algorithm Validation Document (AVD). We will also be providing a more detailed technical description of the data and methods for computing the dynamic baseline in our Algorithm Methods Document (AMD). Our current focus is on developing and validating the dynamic baseline for avoided deforestation projects before extending our methods to reforestation and improved forest management (IFM) projects.
Going forward, we hope to share our ongoing work on dynamic baselines more frequently with market participants, experts, and the general public. Pachama is committed to transparency so that crediting calculations can be open and readily understandable to all. Stay tuned for our upcoming methods and validation documents.
We welcome your questions or feedback at science@pachama.com. For media inquiries please contact us at media@pachama.com.
Ready to learn more?
Get in touch with our team to learn how we can help you invest in tech-verified projects or start your own project from the ground up.
FOOTNOTES
Global Forest Watch reported gross tree cover loss of 25.3 million hectares in 2021. This does not include areas of tree cover gain. The area of the United Kingdom is approximately 24.4 million hectares. 1 hectare equals 10,000 m2 or 2.47 acres.
Global Forest Watch estimates deforestation CO2 emissions of 176 billion metric tons over the period 2001-2021, or 8.4 billion metric tons per year. Annual fossil fuel emissions are approximately 34.4 billion metric tons per year (1).
Fires to clear forest for agriculture directly release carbon to the atmosphere. However, deforestation for timber and paper production also releases carbon, as the timber and paper products decompose over time: toilet paper, napkins, and disposable paper packaging within several months to a few years; cardboard, office paper, and newspaper and magazines within several years as fibers deteriorate with each recycling; and wood products, such as furniture, over a longer period, although this carbon too eventually reaches the atmosphere.
VM0015 Methodology for Avoided Unplanned Deforestation is an example of a methodology that uses a manually selected reference area
We compared 5-year average deforestation rates before and after 2015 in 1,000 randomly sampled 1 million hectare bounding boxes across the Amazon using annual PRODES deforestation maps produced by the Brazilian Space Agency (2). The average difference between recent (after 2015) and past (before 2015) deforestation was >40%.
REFERENCES
Friedlingstein P, O’Sullivan M, Jones MW, Andrew RM, Hauck J, Olsen A, et al. Global carbon budget 2020. Earth Syst Sci Data. 2020;12: 3269–3340.
Instituto Nacional de Pesquisas Espaciais (INPE). PRODES. 2020. Portal TerraBrasilis.Hansen MC, Potapov PV, Moore R, Hancher M, Turubanova SA, Tyukavina A, et al. High-resolution global maps of 21st-century forest cover change. Science.
Hansen MC, Potapov PV, Moore R, Hancher M, Turubanova SA, Tyukavina A, et al. High-resolution global maps of 21st-century forest cover change. Science.